Small companies often believe that they do not have enough Homeowners data to build custom rating territories based on different perils, and therefore simply adopt the territories of a competitor. But size is no advantage when it comes to making rates for hurricane coverage, which is done using catastrophe models. Small companies use the same catastrophe models as large companies and, because catastrophe models are fully credible, a small company can use them to design homogeneous, credible territories just as well as a large company.
By “homogeneous” and “credible,” we mean that all risks within the territory should have the same expected loss and that it should be possible to accurately estimate that expected loss. Typically, Homeowners territories are designed with non-wind perils in mind, primarily fire, even though the risk from each peril has its own unique geographic distribution. In most states, the majority of companies do not recognize this. In Florida, however, the wind peril is so important, and its geographic variation so different from non-wind perils, that all companies recognize that rates must be made separately for wind and non-wind (or, in some cases, hurricane and non-hurricane). But despite this recognition, most companies, even in Florida, use the same rating territories for wind and non-wind perils. This is a compromise that doesn’t really do justice to either—while the wind peril varies predominantly with the distance to the coast, the non-wind perils vary predominantly with population density and other factors. An ideal rating structure would consist of territories that are different for each.
Current practice
Most Homeowners companies use one of two approaches for rating territories in Florida.
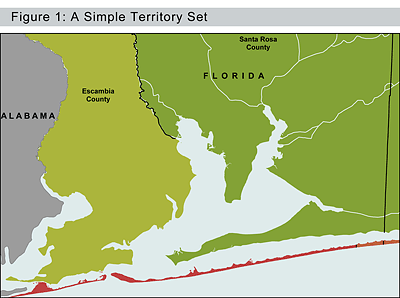
The first approach consists of developing territories that are defined mostly by county boundaries. Because the same territories are used for both wind and non-wind perils, major cities are often isolated as separate territories. These territories are defined based on the county and, in some cases, the city, and are subdivided into a coastal region and an inland region.
Figure 1 (color coded to indicate differences in premiums) shows an example of this approach.-1This territory scheme does not do a good job of matching premium to underlying risk. Although hurricane risk varies continuously from the coast, decreasing rapidly as one goes farther inland, and more slowly as one travels along the coast, this scheme assumes that risk varies by county and by whether a location is on the mainland or the barrier islands. A more sophisticated rating scheme would better recognize that risk varies continuously.
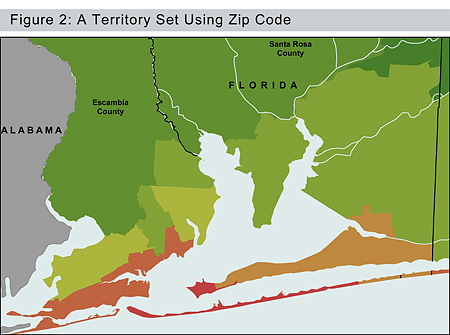
The second approach commonly used today is to define territories based on groupings of ZIP codes, as shown in Figure 2.-2In general, this approach results in more territories than the first. The groupings of ZIP codes try to combine ZIP codes that are a similar distance from the coast and in the same geographic region.
Both approaches, which are currently used by most Homeowners insurance companies, are intended to combine regions that have similar expected losses, but both approaches have significant shortcomings:
- The number of territories is inadequate to accurately differentiate the risk. Simply placing a property on one side of a line or the other results in discontinuities. While wind risk varies continuously, premiums varies vary discontinuously, meaning there are areas that are overpriced and others that are underpriced.
- The dividing line between coastal and inland territories is not usually based on a fixed distance from the coast, but rather on geographic features such as the Intracoastal Waterway. Because those features may vary in their distance from the coast, locations that are the same distance from the coast could be assigned to an inland territory or a coastal territory depending on their position relative to this geographic feature. This creates nonhomogeneous territories and provides more sophisticated competitors with marketing opportunities by offering lower rates for risks that have been overpriced.
- ZIP codes are defined for the convenience of the post office and have no relation to property causes of loss. They are irregularly shaped, meaning that locations at different points within the same ZIP code may be different distances from the coast. They are too big, resulting in locations with very different risk levels being grouped together. The post office changes ZIP codes over time, introducing new ZIP codes or merging existing ZIP codes for its convenience, but such ZIP code updates do not change, or reflect, the underlying risk of property loss.
Recommended practice
An approach that addresses these weaknesses would give a company that implements it an advantage. Specifically, companies should adopt wind territories that are defined based on their distance to the coast, instead of being defined based on ZIP codes or the Intracoastal Waterway. Using the coast as a reference point can pool similar risks together. It is possible to create as many territories as desired by using many different distance-to-coast dividing lines. Utilizing many different dividing lines instead of one can create a greater gradation in premium from one territory to another, meaning that the variation between any two adjacent territories will be small.
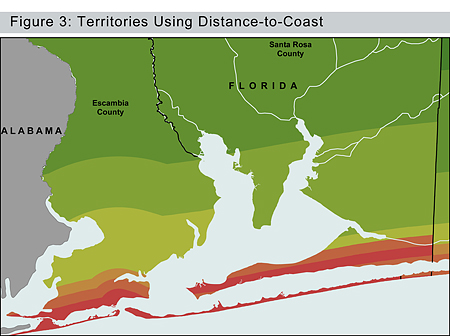
The map in Figure 3 shows hypothetical wind territories that vary based on their distance to the coast.-3These territories have a logical relationship with risk because they follow the steepest risk gradient. They are less than a mile wide near the coast, where the risk varies dramatically over short distances, and they become progressively wider farther inland, where the risk varies much more gradually. Parallel to the coast, the risk varies much more gradually than perpendicular to the coast, so overall, a smaller number of territories are needed.
What is a coastline?
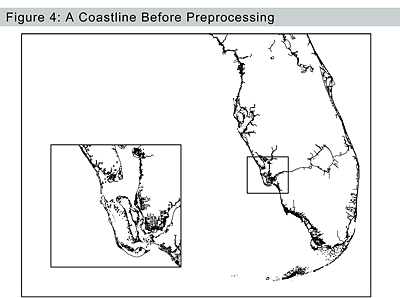
Although it may seem like defining the “coastline” is clear-cut, it is actually quite ambiguous when considering a property’s exposure to a hurricane. Does the coastline follow bays, such as Tampa Bay? Does it follow barrier islands? Does it follow rivers and, if so, how far? After a company decides that it should organize its territories based on distance to the coast, that company's first instinct may be to use an existing coastline. However, such a coastline may not be suitable for the purpose. Off-the-shelf coastlines, such as the one in the map in Figure 4, may follow many small-scale features that do not, in fact, affect hurricane risk.-4The coastline in Figure 4 even follows inland features, such as Lake Okeechobee. A considerable amount of preprocessing work is required to create a coastline that matches the expectation of risk. It is even possible that different coastlines could be used for different purposes. Different hurricane model vendors may have designed their models using different coastlines. If a company wants to calibrate its rating structure to a particular hurricane model, it should use a coastline that matches its preferred model vendor’s interpretation. If the company wants to understand the relationship between risk and storm surge, it makes sense to use a coastline that captures the more finely detailed features that are relevant to storm surge risk. If the company is concerned about wind risk, it makes sense to use a coarser coastline that more closely corresponds to the hurricane peril.
Geographic information systems (GIS) and rate-making
Territories defined using distance-to-coast are built by first defining a coastline. The coastline is simply a large set of line segments defining what we believe the coastline to be for the purpose we have in mind. The coastline is then “buffered,” which means a set of territories is created at various distances from the coastline. An example of this is shown in Figure 3.
Because hurricane risk varies across the state of Florida (e.g., the Florida Keys compared to the panhandle), we do not simply use the distance-to-coast groups as rating territories. Instead, we overlay the distance-to-coast groups onto additional segments that capture the regional variation, such as counties or ZIP codes. The combination of these segmentation rules will result in hundreds of rating territories that divide Florida into relatively homogeneous regions.
In order to rate a policy, it must be “geocoded.” This requires the location’s address to be entered into a “geocoder,” which returns the location’s latitude and longitude. A geographic information system (GIS) program can use that latitude and longitude to determine which territory it is in. This provides the ability to determine the risk at a location much more precisely. Instead of rating the location based on the average risk in a territory, which in turn is based on counties or ZIP codes, this method allows the company to estimate the risk for that specific location. In practice, a company may still choose to create territories that group together similar risks, but the territories can be made as small as necessary, ensuring that each one is homogeneous.
Are the current territories good enough?
A rating structure that includes broadly-defined territories may be good enough in some states. Is this the case with the rating territories that Homeowners companies are currently using in Florida?
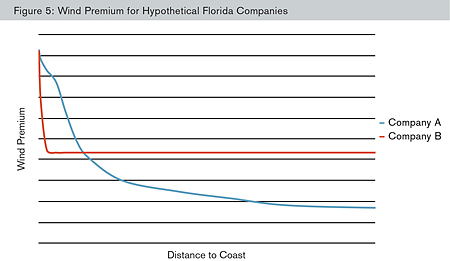
Consider the schematic premiums shown below in Figure 5. The blue line indicates the relative premiums being charged by a hypothetical company, Company A, using many highly granular territories. The red line shows relative premiums from a hypothetical company, Company B, that has just two territories in this region: coastal and inland.
The premiums for Company A are, all else being equal, an accurate reflection of the expected losses, while the premiums for Company B are an approximation—and not a very good one. Figure 6 shows the corresponding rate changes that Company B would need to implement in order to achieve adequate premiums. On the barrier islands, Company B’s premiums are quite close to Company A’s. This is because the barrier islands are narrow and approximate the first distance-to-coast band used by Company A. Moving farther inland, however, Company B’s rates rapidly become severely inadequate. This is because Company B is charging an average inland rate for the portion of its inland territory that is near the coast. Continuing to move farther inland, there is a point where the premium charged by Company A and Company B is the same (see Figure 5), but past that point, Company B’s rates become more and more excessive.
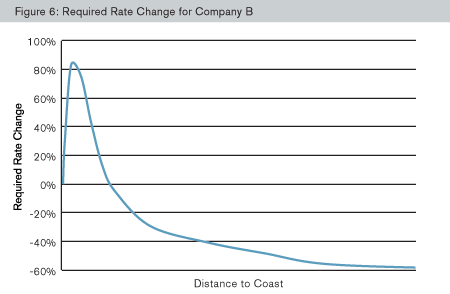
If Company A and Company B are competing in the same market, all else being equal, Company B will write a disproportionate share of the risks near the coast at unprofitable rates, while Company A will write more than its share of the inland risks. Although Company B may attempt to address its inadequate rating structure with underwriting restrictions (making risks near the coast ineligible), it will still write too many unprofitable risks at a rate lower than what is being charged by Company A, which is using a more refined rating structure.
The recommended solution for Company B is to increase its number of territories and to define them based on a location’s distance to the coast. A compromise—introducing, for instance, only four territories, based on ZIP codes that roughly follow the coast—is not the logical end point. For the purpose of writing the best risks, the more gradation, the better. Differences in premium between oversized territories are what allow competitors to skim the cream. Fortunately, even a small company can take advantage of the technical sophistication of catastrophe models by defining more granular territories to avoid taking on risks at inadequate prices.
1 Map created in ArcGIS using metadata sourced from National Atlas, U.S. Census, Florida Department of Transportation, and U.S. Geological Survey.
2 Map created in ArcGIS using metadata sourced from National Atlas, U.S. Census, Florida Department of Transportation, U.S. Geological Survey, NOAA, and Florida Fish and Wildlife Conservation Commission.
3 Map created in ArcGIS using metadata sourced from National Atlas, U.S. Census, Florida Department of Transportation, U.S. Geological Survey, and Florida Office of Insurance Regulation.
4 Map created in ArcGIS using metadata sourced from Florida Fish and Wildlife Conservation Commission.