DECEMBER 2019 EDITION: Milliman analysis shows multiemployer pension funded status bounces back in 2019
Milliman’s December 2019 Multiemployer Pension Funding Study reports on the estimated funded status of all U.S. multiemployer defined benefit (DB) plans as of December 31, 2019.
Key findings
- With double digit returns in 2019, multiemployer DB plans overall have recovered much of the investment losses suffered during 2018.
- The aggregate funded percentage for all multiemployer plans is estimated to be 85% as of December 31, 2019, up from 74% at the end of 2018.
- 85% was also the aggregate funded percentage prior to the 2008 financial crisis. However, there are now a higher percentage of plans above 100% funded and below 50% funded compared to 12 years ago.
- Over the past ten years, the weighted average discount rate has dropped about 50 basis points.
- The aggregate funded percentage of the 130 critical and declining plans at the end of 2019 was 37%. That is half of what it was for the same plans at the end of 2007 (74%).
Current funded percentage
Figure 1 shows that the overall funding shortfall for all plans declined by about $69 billion to a total shortfall of $107 billion during 2019. The aggregate funded percentage improved from 74% to 85% due primarily to asset returns in 2019 exceeding expectations. Our simplified portfolio earned about 21% for 2019. (Plans may invest more broadly across asset classes and management styles than our simplified portfolio which may result in a higher or lower return. For more information about the simplified portfolio, see the section “About This Study” below.)
Figure 1: Aggregate funded percentage (in $ billions)
| 12/31/2018 | 12/31/2019 | Change since 12/31/2018 | |
| Accrued benefit liability | $678 | $712 | $34 |
| Market value of assets | $502 | $605 | $103 |
| Shortfall | $176 | $107 | $(69) |
| Funded percentage | 74% | 85% | 11% |
| Based on plans with complete IRS Form 5500 filings. Includes 1,251 plans as of December 31, 2018, and 1,249 plans as of December 31, 2019. | |||
Historical funded percentage
Figure 2 provides a historical perspective on the aggregate market value funded percentage of all multiemployer plans since the end of 2007.
Figure 2: Aggregate historical funded percentage market value basis
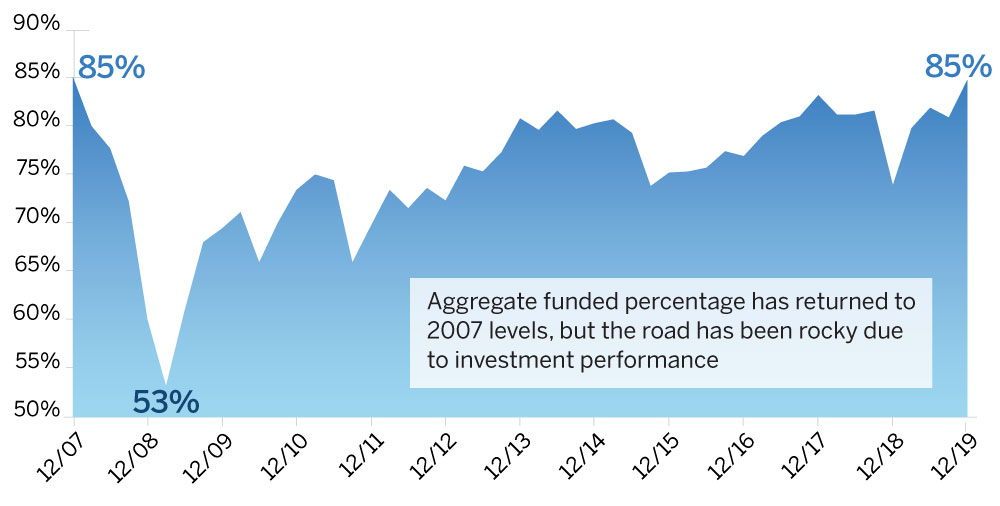
As Figure 2 demonstrates, plan recovery has been bumpy primarily due to investment performance. Many plans are also improving because of the benefit and/or contributions adjustments made through the years, and are currently using excess contribution income over operating costs (i.e. the value of annual benefit accruals plus expenses) to pay down their shortfalls. Despite these changes, many plans continue to operate with negative cash flow (i.e. benefit payments plus expenses exceeding contributions) and remain vulnerable to investment volatility. Plans that have already reduced benefits and/or increased contributions may not be able to withstand another market shock since there is less room for additional adjustments.
The aggregate funded percentage for multiemployer DB plans has returned to the pre-2008 market crash level of 85%. Figure 3 shows the distribution of funded percentages for all plans in the study as of December 31, 2019 as compared to December 31, 2007.
Figure 3: Market value funded percentage (%) 12/31/2007 compared to 12/31/2019
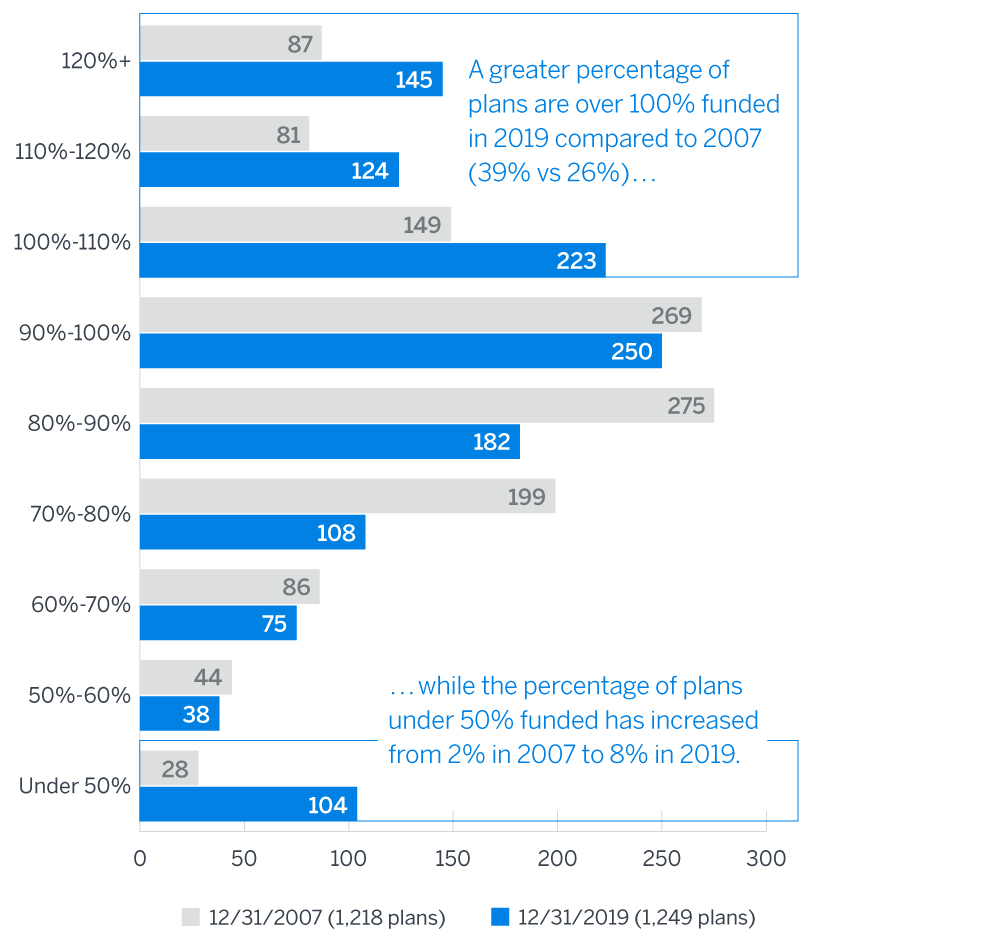
The 2008 market shock exposed the growing maturity of many multiemployer plans. Over the past 12 years, the plans that have been able to make the adjustments necessary to improve funding have separated themselves from the plans that could not, resulting in a wider disparity of plans. While the aggregate funded percentage is now the same as it was back in 2007, the percentage of plans above 100% funded has increased from 26% to 39% while the percentage of plans below 50% funded has nearly quadrupled (from 2% to 8%).
Discount rates
The funded percentages shown in Figures 1 to 3 reflect liabilities measured using each plan’s assumed discount rate (typically the assumed investment return on plan assets). Since the inception of this study, assumed discount rates have generally been in the range of 6% to 8%.
Figure 4 shows the trend of the average discount rate assumption for all plans in our study over the past ten years. In addition to showing the weighted average, we also show the trend in the straight average discount rate, which weights each plan equally and diminishes the impact any one plan has on the overall average.
Figure 4: Average discount rate
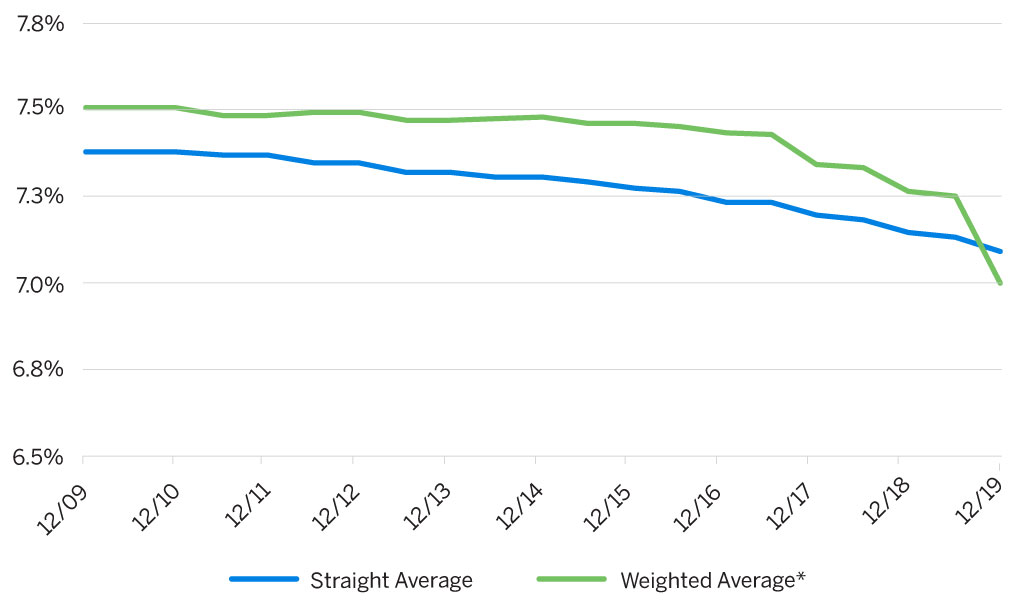
* The drop in the weighted average discount rate over the past couple of years is primarily due to the decrease in the discount rate for one large plan (Central States, Southeast & Southwest Areas Pension Plan).
As the graph depicts, the rate has dropped 30-50 basis points during this time. As noted earlier, the aggregate funded percentage has reached pre-2008 funding levels. However, today’s funded percentage is calculated using an overall lower discount rate than twelve years ago. If the same assumptions were used for both time periods, the aggregate funded percentage would likely be higher today than in 2007, as lowering the discount rate results in higher plan liabilities.
Historical funded percentage by zone status
Figure 5 shows the historical funded percentage of all multiemployer plans since the end of 2007 by the zone status reported on the latest Form 5500. For example, the green line shows the historical funded percentages of plans reported in the green zone without regard to their previous zone statuses. The blue dotted line represents all plans combined.
Figure 5: Aggregate historical funded percentage by zone status
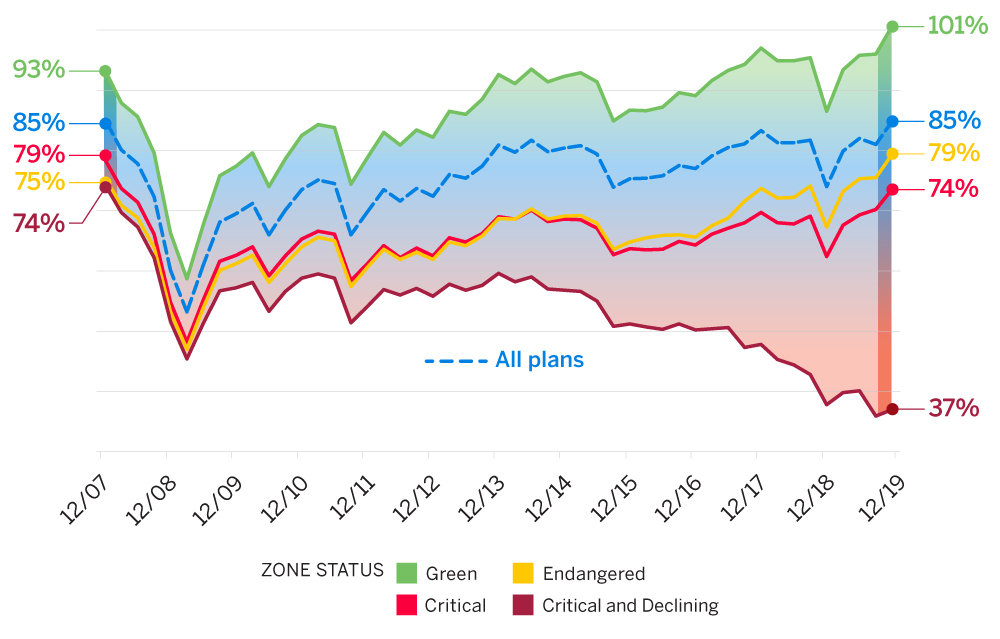
The gap between the non-critical plans and critical and declining plans continues to widen. In the aggregate, non-critical plans have largely recovered from the global financial crisis. Critical plans are not quite back to the funding level they were at prior to the 2008 crash, and prospects for recovery remain tenuous. The aggregate funded percentage of critical and declining plans has been cut in half since 2007. Part of the struggle for less well funded plans is that excess investment returns have a smaller impact as asset values drop.
What lies ahead?
Figure 6 illustrates the impact one year’s investment return can have on the projected funded status. Plans that are critical and declining status now are shown in red, and those that are not are shown in blue . The solid lines represent the impact on the projected funded percentage if actual returns for 2020 differ from each plan’s actuarial assumption by plus or minus 10%, followed by the assumed return for each year thereafter.
Figure 6: Projected funded percentage through 2024 critical and declining vs. all other plans
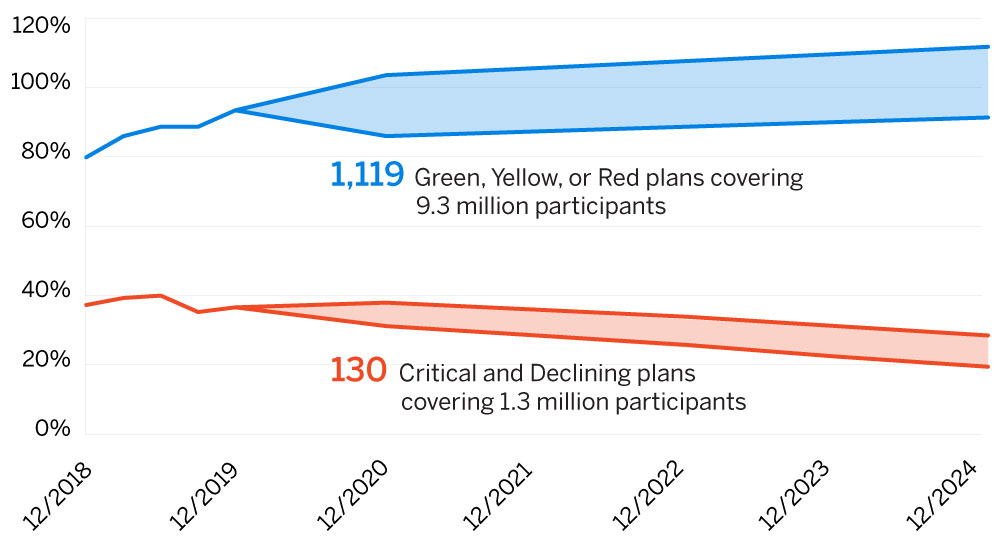
As the figure shows, a one year return of 10% over the assumed rate would accelerate the aggregate recovery of non-critical and declining plans, while a 10% underperformance would be a setback, but still trending up. On the other hand, even with a one-year outperformance of 10%, critical and declining plans in aggregate continue on the path towards insolvency.
Further troubling matters is the impending insolvency of the Pension Benefit Guaranty Corporation (PBGC) multiemployer program itself. In November, the PBGC released its 2019 fiscal year annual report, stating that its multiemployer insurance program “is highly likely to become insolvent during fiscal year 2025.” Under current law, if the program runs out of money, the PBGC would have to reduce guaranteed benefits to levels that could be afforded by premium income only. As discussed in our recent Multiemployer Alert, this could result in drastic reductions to PBGC benefits paid to participants of insolvent plans.
Potential changes in multiemployer plan law continue to be explored and discussed by interested parties.
- Early in 2019 the House of Representatives passed the Rehabilitation for Multiemployer Pension Act (more commonly known as the Butch Lewis Act), which would create loan opportunities for the most troubled multiemployer plans.
- In November 2019, Senators Grassley and Alexander released a white paper describing their ideas to expand the PBGC’s authority to partition troubled plans, increase PBGC premiums to restore the solvency of the agency’s multiemployer program and increase the benefit guarantee, and change zone status rules to allow trustees to reduce certain benefits sooner to improve their plan’s funded status. A summary of the white paper can be found here. One of the key changes is a proposal to cap the discount rate to value plan liabilities at 6.0%. We note that of the 1,249 plans included in this study, only about 90 plans have a discount rate of 6.0% or less.
Since the solutions to address these challenges that have come out of the House and Senate are vastly different, it remains to be seen what a compromise solution may look like or when that might happen.
Trustees and plan professionals should continue to monitor these developments and understand the impact of any potential changes on their plans.
About this study
The results in this study were derived from publicly available IRS Form 5500 data as of December 2019 for all multiemployer plans, numbering between 1,200 and 1,300, depending on the measurement date used. Data for a limited number of plans that clearly appeared to be erroneous was modified to ensure the results were reasonable and a sufficiently complete representation of the multiemployer universe.
Liability amounts were based on unit credit accrued liabilities reported on Schedule MB, and were adjusted to the relevant measurement dates using standard actuarial approximation techniques. For this purpose, each plan’s monthly cash flow, benefit cost, and actuarial assumptions were assumed to be constant throughout the year and in the future. Projections of asset values to the measurement date reflect the use of constant cash flows and monthly index returns for a simplified portfolio composed of 45% U.S. equities (Russell 3000), 20% international equities (MSCI ACWI Ex USA), and 35% U.S. fixed income (Barclays US Aggregate) investments. /p>
Significant changes to the data and assumptions could lead to much different results for individual plans, but would likely not have a significant impact on the aggregate results or the conclusions in this study.