This abstract provides a summary of the briefing note. Please download the PDF for the full analysis.
This briefing note looks at the year-end 2025 solvency and financial condition reports (SFCRs) of a sample of life insurers based in the Netherlands1 and includes an analysis of key information included in the quantitative reporting templates (QRTs) published with the SFCRs.2
In this briefing note, we analyse the SFCRs of the seven largest life entities of Dutch insurers selected based on their total assets as of year-end 2025, as well as the life insurance market as a whole. The total assets of these life insurance entities sum to about €369 billion, representing about 98% of the total assets of life insurers based in the Netherlands. The insurers selected are outlined in the table in Figure 1.
Figure 1: Reported total market value of total assets (figure in € billions)
| INSURER | MV ASSETS YE 2025 |
MV ASSETS YE 2024 |
CHANGE | MKT SHARE (%) |
|---|---|---|---|---|
| NN3 | 126,80 | 132,06 | -5,26 | 34% |
| Aegon4 | 69,07 | 66,61 | 2,45 | 19% |
| Athora5 | 56,46 | 55,30 | 1,16 | 15% |
| a.s.r. | 53,50 | 52,45 | 1,05 | 14% |
| Achmea6 | 40,92 | 42,14 | -1,22 | 11% |
| DELA | 10,69 | 10,23 | 0,46 | 3% |
| Monuta7 | 2,55 | 2,49 | 0,06 | 1% |
| Other | 9,07 | 11,26 | -2,19 | 2% |
| Market | 369,07 | 372,55 | -3,48 | 100% |
The insurers included in the sample are ranked based on total assets. A selection based on written premiums or own funds could produce a different list of insurers. Note that although the acquisition of Aegon by a.s.r. was fully completed in July 2023,8 the legal merger of the life insurance entities has not been completed as of year-end 2025. The total market value of assets of life insurers has remained relatively stable between year-end 2024 and year-end 2025.
SCR coverage ratio for Dutch insurers
The average solvency capital requirement (SCR) coverage ratio for the seven selected insurers was 209% at year-end 2025. On average, the SCR coverage ratio increased over 2025 by more than 20%.
For a.s.r., the SCR coverage ratio increased significantly in 2025. The increase was mainly the result of the implementation of the a.s.r. life entity partial internal model (PIM), approved by DNB in December 2025, which lowered the risk margin, and thereby increased own funds, and reduced required capital primarily through the property risk and longevity risk modules, partly offset by higher required capital from the spread risk and mismatch risk modules. The SCR coverage ratio also increased for the Aegon life entity of a.s.r. over 2025. This was mainly due to higher own funds, driven by market developments and model changes, partly offset by the impact of the three pension buyouts that were completed during 2025.
Achmea also saw its SCR coverage ratio increase over 2025, from 175% to 187%. This increase was mainly driven by the consolidation of Lifetri following the acquisition of Lifetri Group, favourable interest rate movements that reduced the best estimate liability and required capital, and a higher economic value of investments, partly offset by the initial impact of the FrieslandCampina pension buyout and a reduction in eligible own funds (EOF) from Sixth Street's new 20.45% minority stake in Achmea Pensioen & Leven.
For NN, the SCR coverage ratio increased sharply in 2025. Positive market impacts, favourable changes in non-EOF and a new longevity reinsurance transaction completed in the first half of the year, partly offset by model and assumption changes, were the main drivers of this increase.
DELA's SCR coverage ratio increased from 201% to 213% over 2025, driven by two factors. First, the coverage ratio increased due to model changes. Second, a 2025 tax change brought all Dutch insurance activities into scope, irrespective of whether policies are administered from the Dutch head office or from the Belgian and German branches, which contributed positively to the coverage ratio.
On the other hand, Monuta saw its SCR coverage ratio sharply decline in 2025. This decrease was driven by interest rate developments in the first quarter, which reduced available own funds while increasing required capital, particularly for interest rate risk and lapse risk, compounded by an update to cost assumptions, mainly reflecting IT cost developments.
Athora’s SCR coverage ratio remained stable over 2025. This reflects its increased operating capital generation and positive impact from methodology and assumption changes, reinsurance agreements offset by shareholder capital distributions, investment deployment and market impacts.
Figure 2: Own funds, SCR and SCR ratio of the selected insurers (own funds and SCR in € billions)
| INSURER | 2025 | 2024 | 2023 | |
|---|---|---|---|---|
| NN | Own funds | 10,8 | 9,1 | 10,2 |
| SCR | 4,8 | 4,9 | 5,2 | |
| SCR ratio | 223% | 187% | 196% | |
| Aegon | Own funds | 4,6 | 4,5 | 4,0 |
| SCR | 2,3 | 2,3 | 2,4 | |
| SCR ratio | 202% | 194% | 170% | |
| Athora | Own funds | 3,4 | 3,5 | 3,4 |
| SCR | 1,8 | 1,8 | 1,6 | |
| SCR ratio | 193% | 194% | 210% | |
| a.s.r. | Own funds | 5,0 | 4,3 | 4,0 |
| SCR | 2,2 | 2,4 | 2,2 | |
| SCR ratio | 231% | 177% | 176% | |
| Achmea | Own funds | 3,5 | 3,1 | 2,6 |
| SCR | 1,9 | 1,8 | 1,5 | |
| SCR ratio | 187% | 175% | 177% | |
| DELA | Own funds | 3,2 | 2,6 | 2,5 |
| SCR | 1,5 | 1,3 | 1,2 | |
| SCR ratio | 213% | 201% | 207% | |
| Monuta | Own funds | 1,0 | 1,0 | 0,9 |
| SCR | 0,6 | 0,6 | 0,5 | |
| SCR ratio | 149% | 180% | 188% | |
| Market | Own funds | 32,3 | 29,0 | 28,5 |
| SCR | 15,4 | 15,5 | 15,0 | |
| SCR ratio | 209% | 187% | 190% | |
The average market SCR coverage ratio has been increasing from 190% in 2023 to 209% in 2025. The increase in the average market ratio is due to the favourable market environment, including rising interest rates and a wave of new longevity reinsurance transactions.
Impact of the volatility adjustment on insurers in the Netherlands
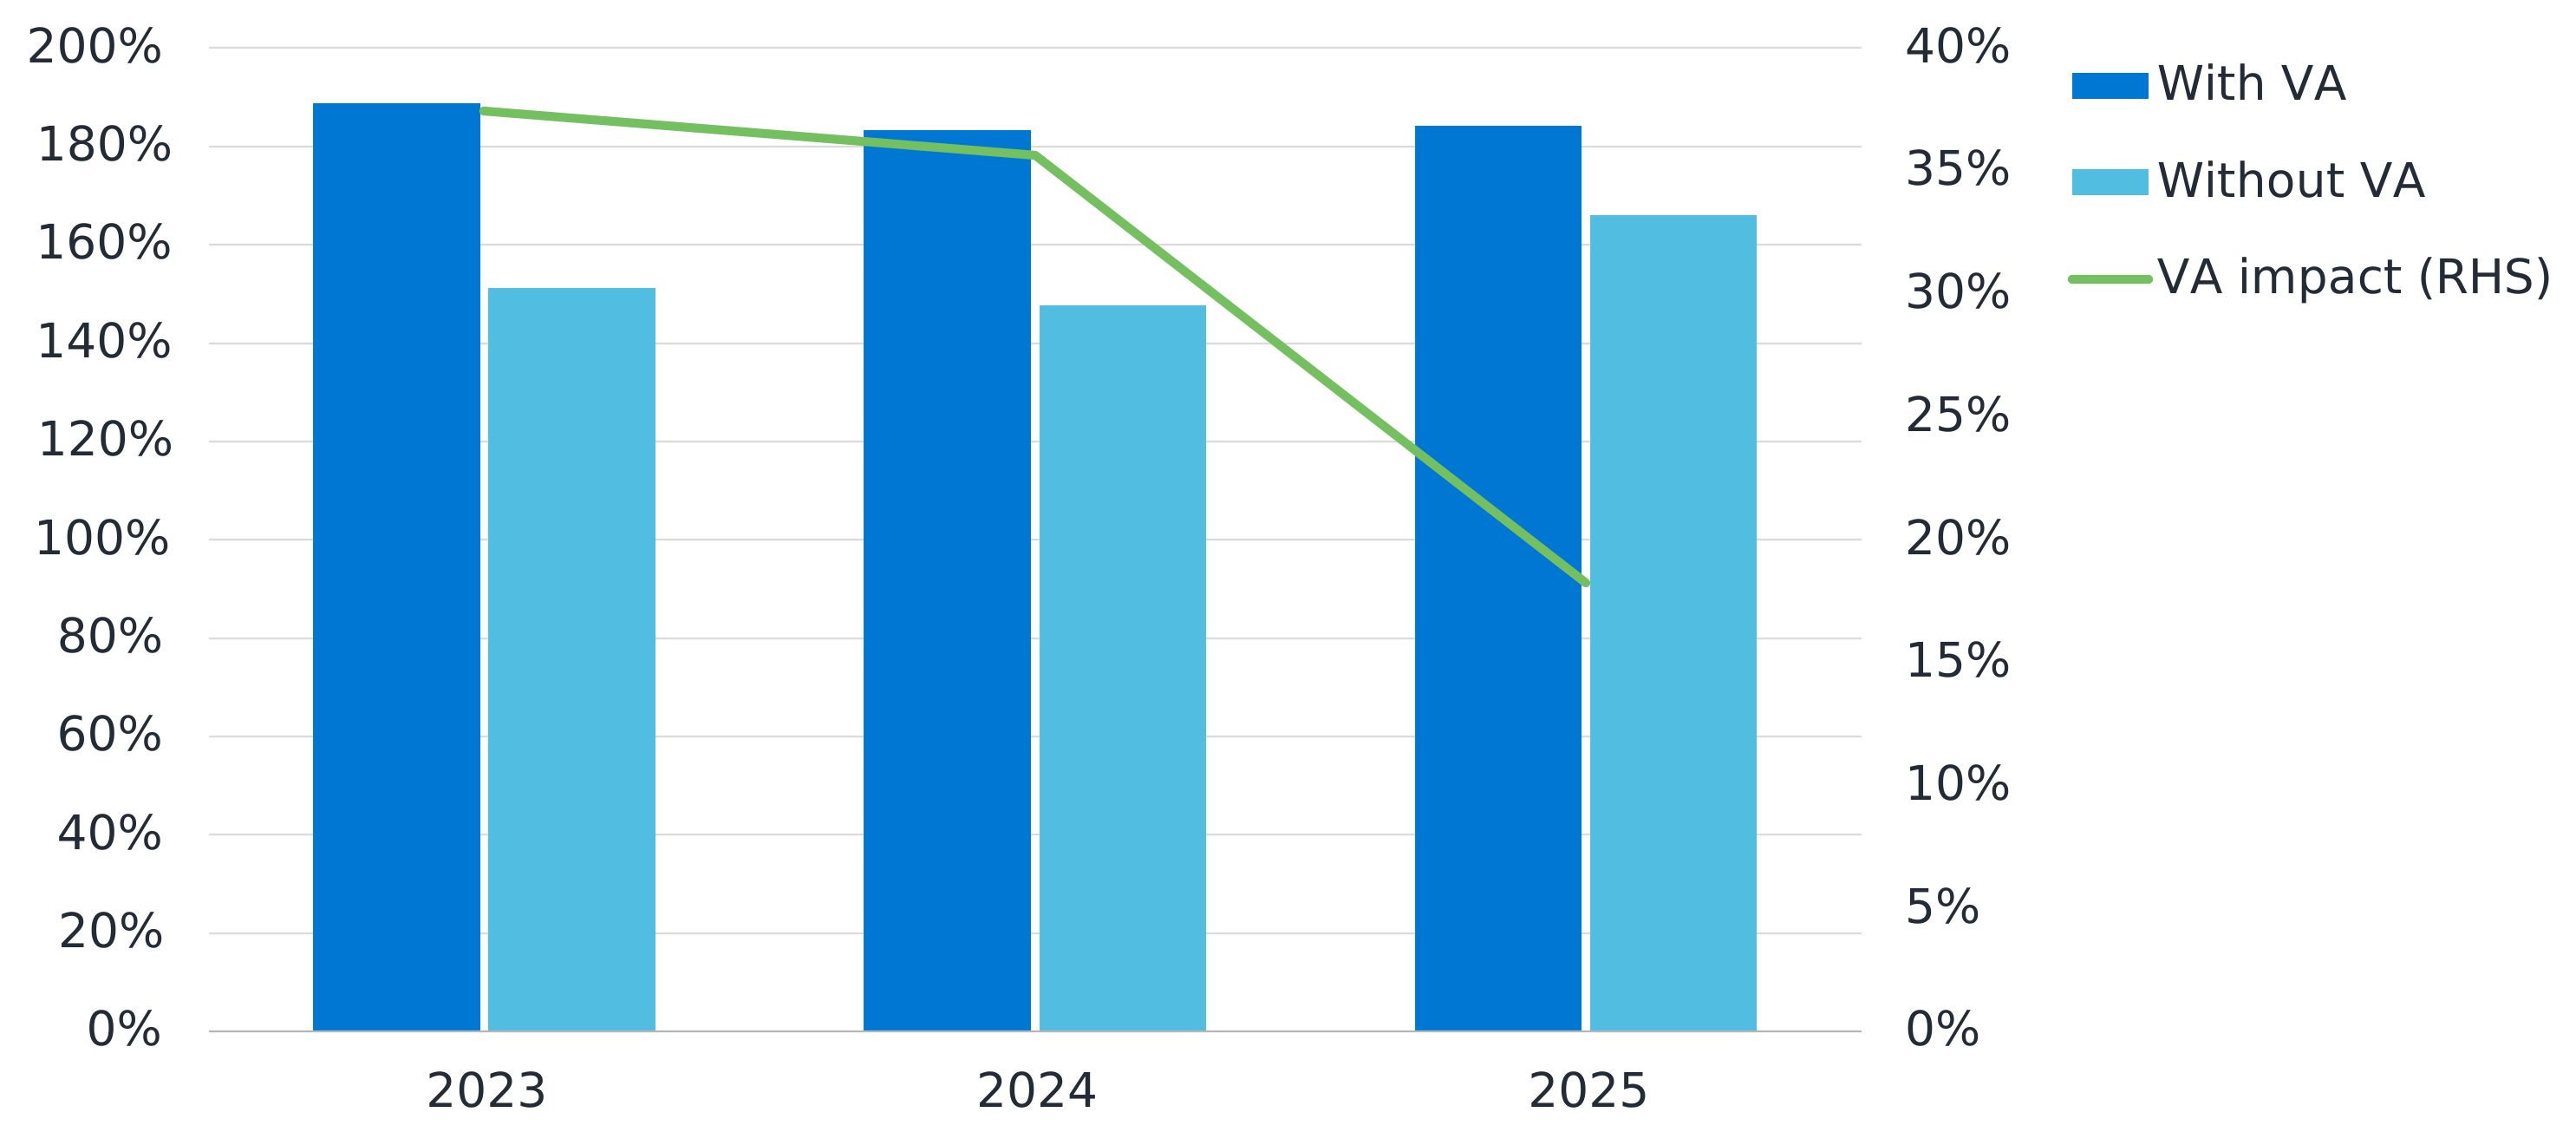
The volatility adjustment (VA) remains a widely used long-term guarantee measure among life insurers. To illustrate its impact, Figure 3 shows the SCR coverage ratio (sum of own funds over sum of SCR) of all life insurers using the standard formula, both with and without the VA. The data reveal a decrease in the effect of the VA from 2024 to 2025. The VA impact has decreased from 36 percentage points in 2024 to 18 percentage points in 2025.
Figure 3: Impact of the VA on the SCR coverage ratio of all life insurers reporting SCR coverage ratios using the standard formula
SFCR reports for Dutch life insurers: A look at eligible own funds
EOF are divided into three tiers based on quality: Tier 1 capital has the highest ranking with the greatest loss-absorbing capacity, such as retained earnings and share capital. Tier 2 capital is typically composed of hybrid debt, and Tier 3 typically comprises deferred tax assets. Own funds in the market are dominated by Tier 1, which makes up 86% of the own funds in 2025. The distribution of the own funds over the tiers has been stable over the last few years.
On average, the seven largest insurers show a similar pattern to the market. Own funds consist predominantly of Tier 1 own funds. A limited amount of own funds consists of Tier 2 and 3 capital. Of these seven insurers, only NN and Athora have Tier 1 restricted own funds.
What is the investment mix for Dutch life insurers?
As of year-end 2025, the total market value of investments under the Solvency II balance sheet stands at €183 billion, marking a minor 1.68% decline from year-end 2024 (€186 billion). Note that not all assets—for instance, mortgage loans—are part of the investments under the Solvency II taxonomy. Government and corporate bonds, which are the largest investment classes, constituted 48% of the investments at year-end 2025. However, their share of total investments has decreased from 2024 by 4% after having declined by a total of 36% from 2016 to 2024.
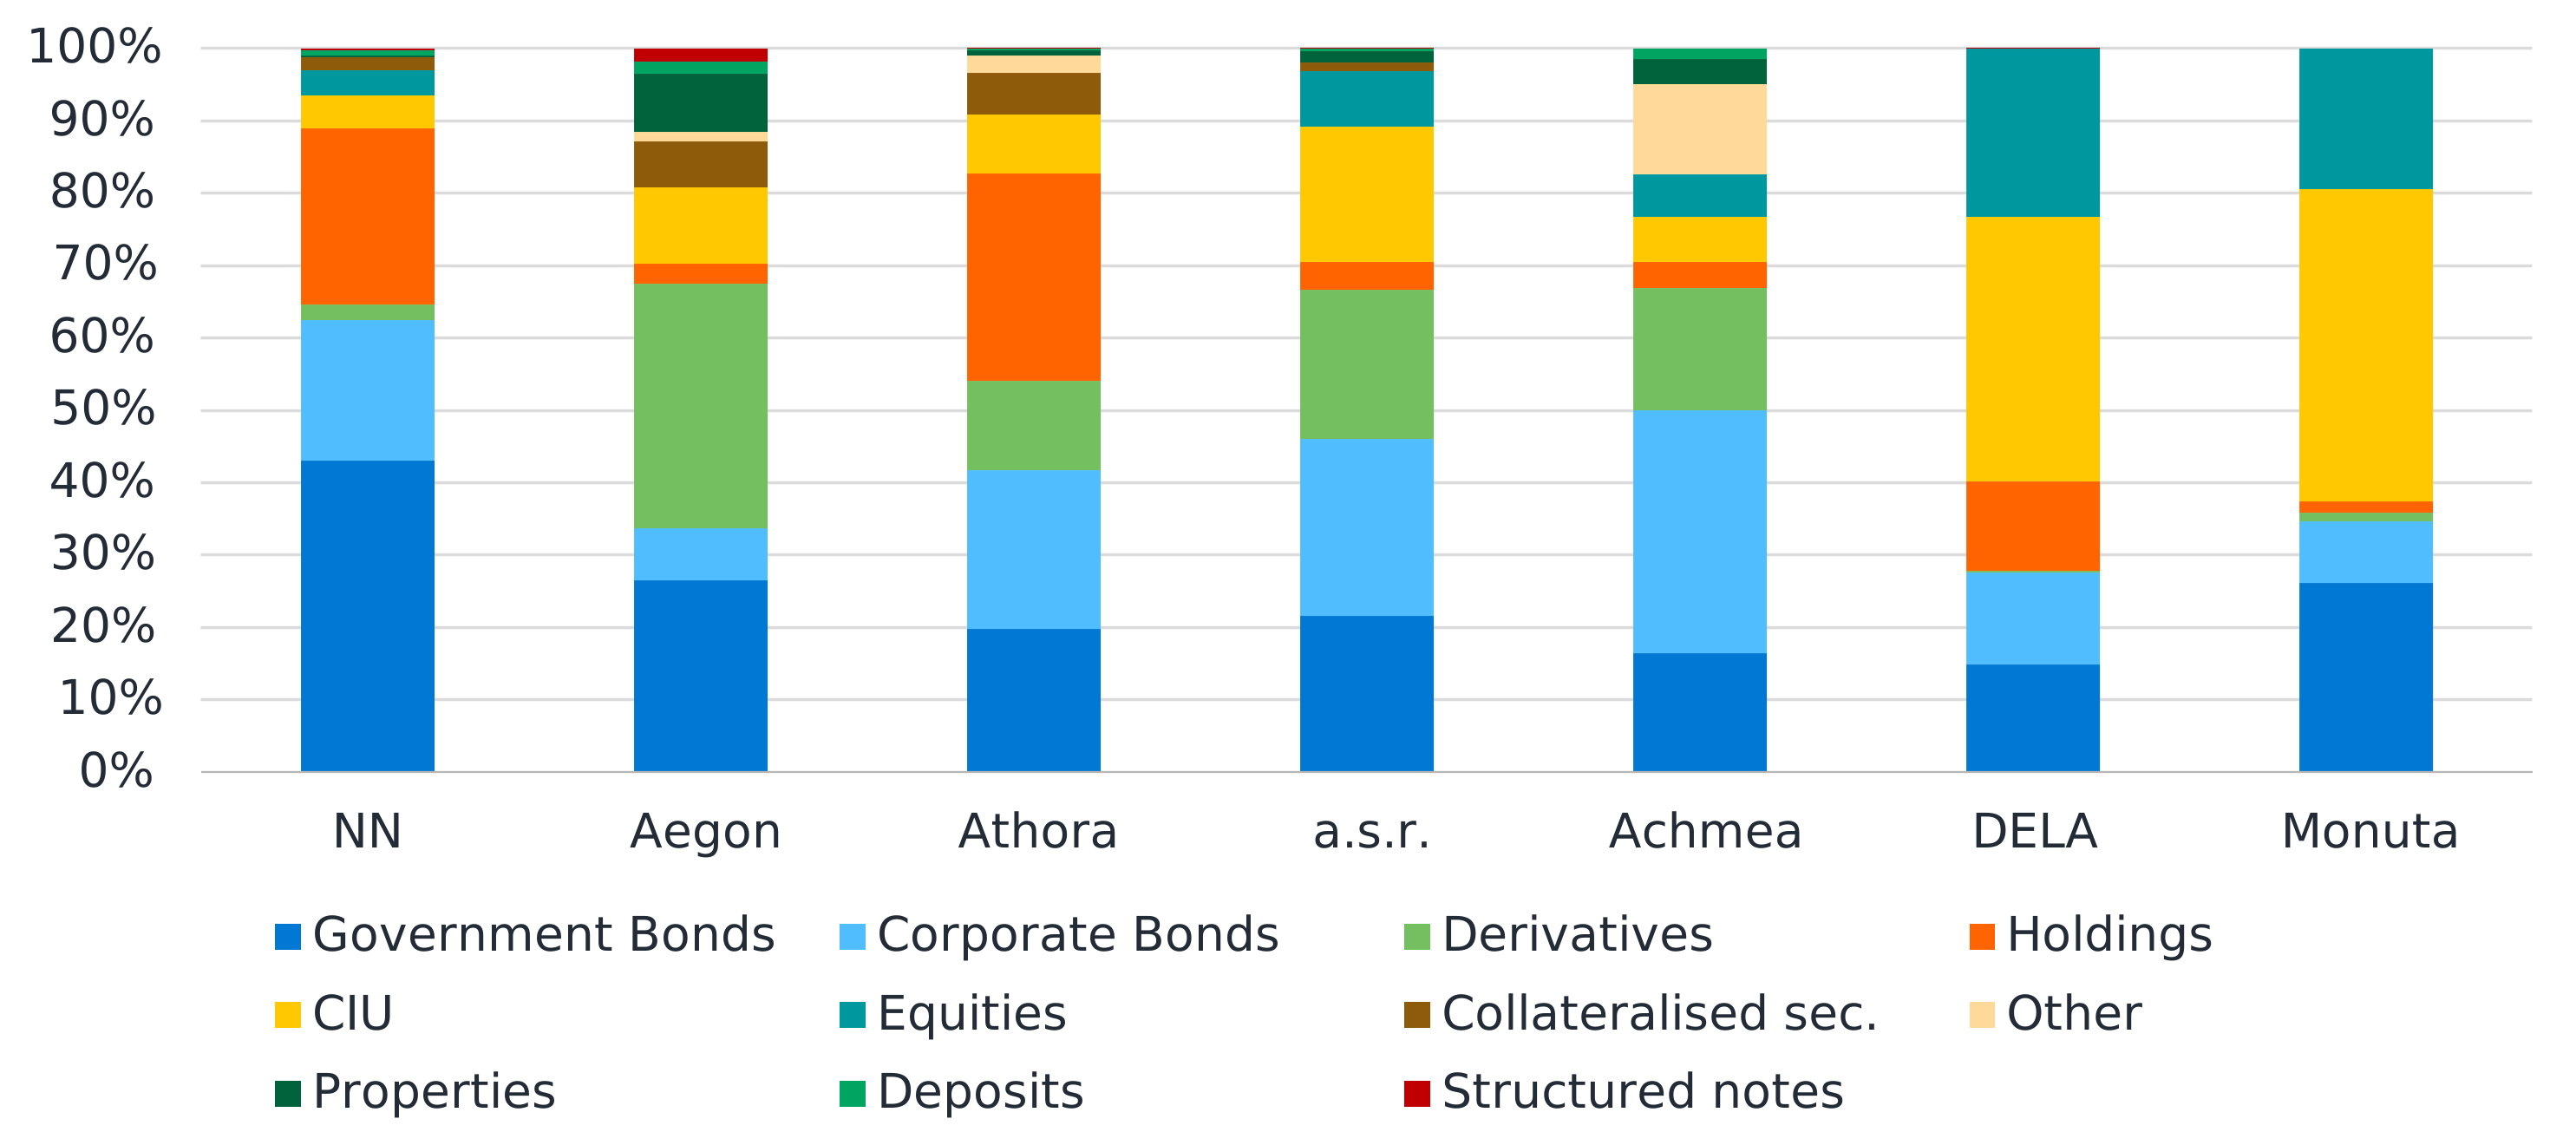
Figure 4 shows the investment mix for each selected insurer; most have a large proportion invested in bonds. Athora and NN exhibit a relatively large proportion of investments in holdings. For NN, this reflects both its joint ventures and the Solvency II treatment of participations, where non-Solvency II entities are not consolidated line by line but recognised as associates at their local regulatory capital, concentrating them in a single holdings line. Whereas for Athora, holdings primarily consist of wholly owned equity funds. DELA and Monuta show relatively large exposures to collective investment undertakings (CIUs).
These figures do not represent any allocation to private credit investments. A European Insurance and Occupational Pensions Authority (EIOPA) study9 conducted in 2025 indicates that private credit has become a fast-growing allocation for European insurers, rising from 3.9% of total assets at year-end 2016 to 5.8% by mid-2025. Life insurers hold the largest amount of private credit exposure among insurers, accounting for more than half of the total. The Netherlands is one of only three jurisdictions alongside Germany and France that together account for roughly 72% of insurers' private credit exposure. This trend is not directly visible in the SFCR investment breakdown because private credit has no single reporting category. It is spread across non-listed corporate bonds, mortgages and loans, structured notes, collateralised securities and indirect holdings through funds.
Figure 4: Investment mix by insurer per year-end 2025
Technical provisions: What is the risk margin for Dutch life insurers?
The total technical provisions for the selected insurers show that for five out of seven insurers, the risk margin is relatively small, between 2% and 4%, compared to the total technical provision. However, for DELA and Monuta, the risk margin is a significantly large part of the total technical provision. The relatively lower best estimate liability value compared to the other life insurers is caused by a larger proportion of premium income in future years for funeral insurance coverages.
In recent years, declining risk-free rates (RFR) and the Ultimate Forward Rate (UFR) have contributed to a rise in technical provisions for insurers. In the Dutch life insurance market, total technical provisions (best estimate liabilities + risk margin) have steadily increased, growing from €278 billion in 2022 to €293 billion in 2023 and reaching €301 billion in 2024. However, in 2025, the RFR increased significantly. This results in a decrease of the total technical provisions to an amount of €286 billion in 2025.
Analysis of premiums for life insurance companies in the Netherlands
The gross written premiums (GWPs) for all life insurers have increased by 20% from 2024 (€13,1 billion) to 2025 (€15,7 billion). This is predominantly caused by an increase in pension buyouts under other life. Note that the life with profit participation business is mainly funeral business, which still has profit-sharing features in place for some products.
In Figure 5, it can be seen that NN showed a decrease in GWP in 2025, while the other selected insurers saw an increase. The Aegon life entity of a.s.r. saw a relatively high increase in GWP compared to its peers; this is due to the closing of three pension buyouts for an amount of €2,8 billion. Similarly, Athora saw an increase in its GWP partly because of the closing of two pension buyouts amounting to around €1,1 billion.
Figure 5: Gross Written Premium (GWP) of selected insurers, 2025 and 2024 (€ billions)
| INSURER | GWP YE 2025 | GWP YE 2024 | CHANGE |
|---|---|---|---|
| NN | 4,00 | 4,85 | -0,85 |
| Aegon | 3,47 | 1,11 | 2,36 |
| Athora | 3,14 | 2,85 | 0,30 |
| a.s.r. | 2,50 | 2,03 | 0,48 |
| Achmea | 0,96 | 0,65 | 0,31 |
| DELA | 0,79 | 0,76 | 0,03 |
| Monuta | 0,21 | 0,20 | 0,01 |
| Other | 0,67 | 0,70 | -0,03 |
| Market | 15,75 | 13,14 | 2,61 |
Similar to the market, individual insurers show a comparable split of premiums in different lines of business. NN, a.s.r. and Aegon sell a relatively large proportion of index-linked and unit-linked products, which are mostly group defined contribution business. Athora and Achmea sell more traditional life-type products. The relatively large proportion of ‘other life’ premiums from Aegon and Athora is because of the aforementioned pension buyouts. For Achmea, a.s.r. and Athora, we have also observed an increase in volume of annuities.
What’s next for Dutch insurers after Solvency II changes become effective in 2027?
The Solvency II 2020 review introduces key changes that will become effective early 2027, including a new approach to interest rate extrapolation, reduced capital costs in risk margin calculations and stricter calibration of interest rate risk with negative rate scenarios. The VA becomes less volatile and more tailored to insurer mismatches, long-term equity rules are enhanced, and Pillar 3 disclosures are streamlined. Insurers will need to adapt their reporting and model landscape and revise their governance, policies and operational processes.
Milliman Benelux has developed an interactive application to efficiently compare the metrics of insurers as disclosed in their QRTs. If you want to know more and get free access to it, please follow the link at https://apps.nl.milliman.com/ or send an email to [email protected].
If you have any questions or comments about the information discussed here, or would like to learn more about Milliman and our services, please contact your usual Milliman consultant.
1 This analysis is based on direct writers only. Reinsurers were excluded from the analysis.
2 The data of individual insurers included in this briefing note have been sourced from Solvency II Wire data and companies’ disclosed SFCRs and QRTs. The data are available via subscription from https://www.solvencyiiwire.com/solvency-ii-wire-data-demo/.
3 NN refers to Nationale-Nederlanden Levensverzekering Maatschappij N.V.
4 Aegon refers to the legal entity Aegon Levensverzekering N.V.
5 Athora refers to the legal entity SRLEV N.V.
6 Achmea refers to the legal entity Achmea Pensioen- en Levensverzekeringen N.V.
7 As the data for Monuta Verzekeringen N.V. have not yet been published, this article refers to the legal entity Monuta Holding N.V.
8 . a.s.r. (4 July 2023). a.s.r. gets the green light for combination with Aegon Nederland. Retrieved 22 July 2026 from https://www.asrnederland.nl/nieuws-en-pers/pers/20230704-asr-rondt-transactie-voor-samenvoeging-met-aegon-nederland-af.
9 European Insurance and Occupational Pensions Authority. (15 December 2025). Financial Stability Report – December 2025. Retrieved 22 July 2026 from https://www.eiopa.europa.eu/publications/financial-stability-report-december-2025_en.