Introduction
This brief is a follow-up to our initial analysis of the Centers for Medicare and Medicaid Services (CMS) public use file data for the independent dispute resolution (IDR) process of the No Surprises Act (NSA).1 Our previous work observed that IDR entity (IDRE) dispute decisions favored surprise providers more than 85% of the time,2 and the awards significantly exceeded the qualifying payment amounts (QPA) defined in the regulation. In addition, because the dispute loser must pay the IDRE’s administrative fee, most of the fees have been paid by health plans. This brief focuses specifically on the value of transparency data in the context of payments for physician emergency room (ER) services. We compared the amounts awarded to surprise, out-of-network ER physicians by IDREs to the payments that the major commercial health plans pay to in-network ER physicians. The data we analyzed for the most common three types of ER visits show that IDR award amounts are often thousands of dollars more than what typical commercial health plans pay for the same types of ER visits. This brief describes our analysis and observations.
ER visits are the most common service for which IDR disputes are initiated, and 39% of all IDR disputes are initiated on behalf of providers practicing in Texas. Accordingly, we chose to study IDR awards and in-network fees for physician ER visits in a Texas city, and we selected Houston.
Nearly all physician ER visit claims are represented by one of the following three HCPCS3 codes:
- 99283: Emergency department visit for the evaluation and management of a patient, which requires a medically appropriate history and/or examination and low level of medical decision-making
- 99284: Emergency department visit for the evaluation and management of a patient, which requires a medically appropriate history and/or examination and moderate level of medical decision-making
- 99285: Emergency department visit for the evaluation and management of a patient, which requires a medically appropriate history and/or examination and high level of medical decision-making
Since we are only considering the physician component of these services, the rates we discuss do not include the overhead cost of the ER facility or any medicine administered to the patient. If the doctor performs an additional service, such as a minor surgery, that would be billed under a separate service code. These three service codes cover a physician’s time and expertise to assess and diagnose the patient. In the analysis that follows, we examine current market payments to ER doctors, which presents a question for the reader: What is the right payment for an ER physician visit?
Sample market rates for ER visits
According to the recent CMS public use file data for Houston, there were over 35,000 disputes resolved by an IDRE in 2025 for the three ER visit HCPCS codes.4 Figure 1 below shows the prevailing offer (i.e., the amount awarded to the provider) for each code by percentile.
Figure 1: prevailing offers for houston IDR disputes resolved in 2025
| IDR Prevailing Offers | 99283 | 99284 | 99285 |
|---|---|---|---|
| Dispute count | 4,920 | 24,364 | 6,454 |
| 25th Percentile | $255 | $357 | $703 |
| 50th Percentile | $1,484 | $658 | $956 |
| 75th Percentile | $3,167 | $2,695 | $1,482 |
| 90th Percentile | $5,947 | $4,797 | $4,594 |
| Maximum | $8,625 | $24,180 | $15,947 |
Figure 1 shows that the amounts awarded for these services vary widely in Houston. For code 99283, a visit requiring low-level medical decision-making, the 25th percentile is $255, while the 75th percentile is $3,167—more than 12 times higher. These disputes are not isolated one-off situations; from the dispute count in Figure 1, we can see that there are over 1,200 disputes in each quartile range. Figure 1 raises some immediate questions: Why did IDREs award $255 or less in a quarter of cases but also award amounts of $3,167 or more in a quarter of cases for the same service code in the same city? What information and factors were considered by IDREs that could explain these types of differences occurring on such a regular basis?
It is also worth noting that the median award for the lowest complexity code exceeded that of the moderate- and high-complexity codes. While it is not surprising that awards determined by a variety of IDREs across different circumstances would differ, the misalignment from the price relativity found in CMS fee schedules for these codes is surprising.
In Figure 2, we show the ratio of the Figure 1 award amounts to what Medicare would pay for the same services if rendered to a Medicare-covered patient in Houston. We call this ratio the percent of Medicare. The 2025 Medicare allowed fees for the Houston market were $71, $122, and $176 for 99283, 99284, and 99285, respectively.
Figure 2: Houston ER visit disputes resolved in 2025 as a percent of Medicare
| IDR Prevailing Offers | 99283 | 99284 | 99285 |
|---|---|---|---|
| Dispute Count | 4,920 | 24,264 | 6,454 |
| 25th Percentile | 359% | 294% | 398% |
| 50th Percentile | 2,086% | 541% | 542% |
| 75th Percentile | 4,453% | 2,217% | 840% |
| 90th Percentile | 8,362% | 3,946% | 2,604% |
| Maximum | 12,126% | 19,888% | 9,039% |
Figure 2 shows that the awards were substantially higher than what Medicare pays, with the 25th percentile paying around three to four times the Medicare fees, while the 50th percentile is more than five times and up to twenty times the Medicare fees. The percent of Medicare is substantially higher for the higher percentiles (e.g., over eighty times Medicare fees, at the 90th percentile for 99283).
Since we know that commercial health plans usually pay more than Medicare pays for professional services,5 our next step was to compare the IDR awards to the commercial fees paid in Houston by some of the largest commercial health plans. We examined the ER visit fees that Aetna, BCBS of TX, Cigna, and UnitedHealthcare report for their popular group commercial products in their recent Transparency in Coverage (TiC) machine readable files.6 These carriers were chosen because they are the largest commercial carriers in Texas and represent the vast majority of the market.
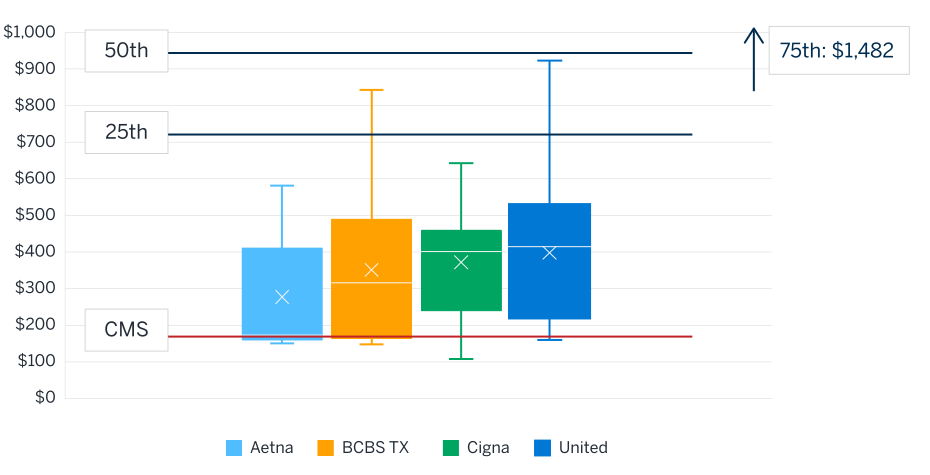
In Figures 3, 4, and 5 on the following page, we compare the IDR prevailing award amounts for each HCPCS code from Figure 1 to the range of reported contractual fees with in-network physicians for Aetna’s Choice POS II,7 BCBS of TX’s Blue Choice PPO, Cigna’s OAP, and UnitedHealthcare’s Choice Plus. In these Figures, the horizontal red lines represent the CMS Medicare rate, the blue lines represent the IDR awards at the 25th or 50th quartile, and the brackets distinguish the range of commercial fees observed in each health plan’s TiC data, with an X marking each health plan’s average reported fee.
Figure 3 shows that for HCPCS 99283, most of the commercial group contractual fees were substantially higher than the Medicare fees. The maximum commercial fee paid by Cigna was $241, which is 6% lower than the 25th percentile of IDR awards at $255 (the blue line). We know from Figure 2 that the 25th percentile IDR award of $255 equals 359% of Medicare. By taking the ratio of Cigna’s $241 fee to the $255 IDR award, we can calculate that Cigna’s fee is 339% of Medicare. The median of all the Figure 3 commercial fees is $126, which is 177% of Medicare. Thus, the 25th percentile IDR award is more than double the median in-network fee for 99283.
The higher quartiles cannot be shown in Figure 3 without completely eclipsing the range of commercial TiC rates. As we described above, the 25th percentile of IDR awards is about 6% higher than the highest contracted commercial fee in the market, but the 50th and 75th percentiles are six times and thirteen times the maximum commercial fee, respectively.
We see similar patterns for 99284 and 99285 in Figures 4 and 5, respectively. In each case, more than half of IDR awards were higher than the highest contracted commercial fee.
In summary, returning to code 99283, we find:
- A physician treating a Medicare member would be paid $71.
- A physician treating a typical commercially insured member would be paid around $125.
- The highest-paid in-network physician in the market might be paid $250.
- But a physician who submits this claim to an IDRE could be paid thousands of dollars.
Provider advocates argue that because IDREs are overwhelmingly siding with providers and are awarding amounts that are multiples higher than typical reimbursement rates, the IDR awards may be evidence that CMS rates and contracted commercial rates are far too low, and the IDR awards are closer to the amounts that providers ought to receive for these services. But looking again at HCPCS 99283, the provider has classified the visit as requiring a low level of medical decision-making, and as noted in the introduction, this code excludes facility costs and any other services performed for the patient; it only covers the patient evaluation, which is likely 15 to 20 minutes of the physician’s time.
Figure 3: TiC physician rates for HCPCS 99283 for major group commercial networks compared to quartiles of IDR award amounts and the CMS Medicare rate
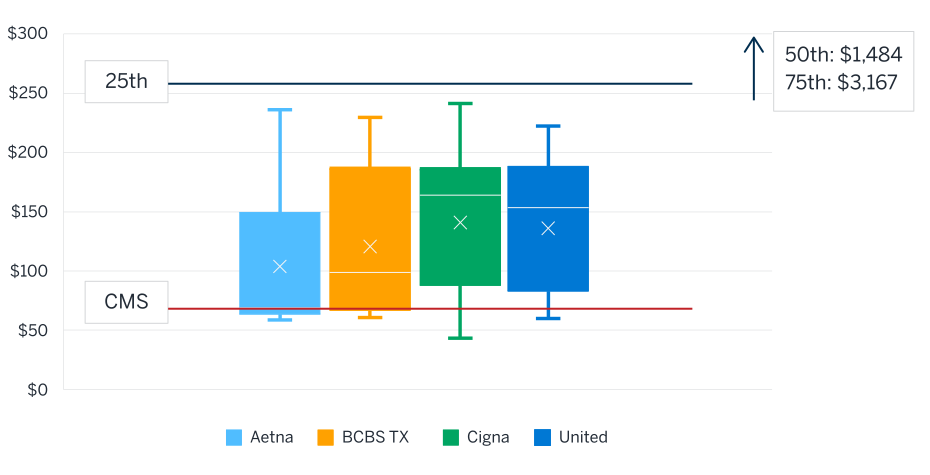
Figure 4: TiC physician rates for HCPCS 99284 for major group commercial networks compared to quartiles of IDR award amounts and the CMS Medicare rate
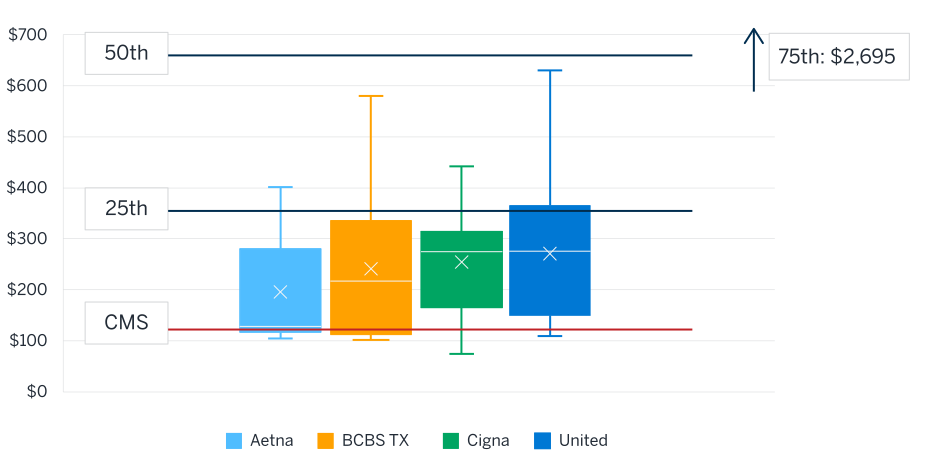
Figure 5: TiC physician rates for HCPCS 99285 for major group commercial networks compared to quartiles of IDR award amounts and the CMS Medicare rate
Conclusion and potential solutions
What should an ER visit cost? Dozens of payers and providers have answered that question through countless negotiations, establishing commercial reimbursement rates ranging from just over one hundred dollars for a simple case to a few hundred dollars for a more complex case. However, the IDR outcomes presented in this brief appear disconnected from those market forces and often come in at multiple thousands of dollars above Medicare rates and commercial in-network rates.
As discussed in our previous brief, there is a strong financial incentive for providers to initiate a large number of IDR cases and pursue large reimbursement rates. In some cases, providers may even be incentivized to withdraw from networks to seek these higher out-of-network rates. This could be disruptive to the U.S. healthcare system and may lead to inefficiencies and unnecessary administrative burden and costs, which could ultimately raise premium rates. In order to realign these incentives, regulators and IDREs could use transparency payment data to better align IDR outcomes with market forces.
If IDREs make prevailing in-network rates for similar providers a significant factor in their decision-making process, this could curb the more extreme outliers and mitigate the incentive for providers to withdraw from networks. Since IDREs are limited to choosing either the provider’s offer or the payer’s offer and cannot create their own payment determination, IDREs should consider the full range of TiC rates when reviewing disputes and should assess how the provider compares to the range of providers represented in the TiC data. The IDRE could then select the offer that more closely aligns with the market’s in-network payments for similar providers who are providing similar services.
Contact Milliman if you would like help with evaluating your approach to IDR disputes or if you would like to learn more about the transparency data that is available in your markets.
1 Phillips, S., Singleton, A., & Rachlin, S. (August 5, 2026). No Surprises Act – Early results and emerging trends. Milliman brief. Retrieved November 5, 2026, from https://www.milliman.com/en/insight/no-surprises-act-early-results-emerging-trends.
2 We refer to providers performing the services covered by the NSA as surprise providers. These could be providers at out-of-network (OON) facilities in emergent situations or OON providers at in-network (IN) facilities in non-emergent situations.
3 HCPCS is an abbreviation for the American Medical Association’s Healthcare Common Procedural Coding System.
4 CMS collects IDR transaction information and posts quarterly public use files with the dispute volumes, characteristics, and results. We relied on the CMS data. While we removed clear errors and reviewed the data for reasonability, we did not fully audit the data; see caveats at the end of this brief.
5 Marshall, S., Zhou, D. & Mills, C. (July 24, 2025). Commercial reimbursement benchmarking 2025. Milliman white paper. Retrieved November 5, 2026, from https://www.milliman.com/en/insight/commercial-reimbursement-benchmarking-medicare-ffs-rates-2025.
6 We used Milliman Transparent, a transparency data analytics product that analyzes payer- and hospital-reported machine readable file data collected by Turquoise Health.
7 Aetna reports many fee schedules for each provider group in their TiC data. For this analysis, we have included the full range of fee schedule payments, including the highest rate posted by Aetna for each code within their Choice POS II network.